# Methods and Technical Concepts
# Spatial Accessibility
Determining the spatial "accessibility" of a specific service location (supply location) for residential areas of the population (demand locations) using 2SFCA method groups or gravity-based accessibility analyses is more complex than the usual geographical questions like:
Catchment area question: Does a particular person live within the catchment area of a service provider? (Answer yes/no)
Distance question: What distance (time or distance measures like minutes or kilometers) must be covered between supply and demand locations? (Answer value in time or minutes)
These more common geographical analyses do not answer the question of whether the service is even available to the population or specific demand groups (question about a dimension of accessibility in the context of capacity). That is, the above questions do not address the local demand for this provider. Luo and Qi developed the
Enhanced Two-Step Floating Catchment Area (E2SFCA) method (opens new window) to enable a measurement that is intuitively meaningful for determining spatial access to (health) services.
For the calculation of Enhanced2SFCA, the following input data should be available:
- Demand locations - or - areas (preferably small spatially as point or shape feature class)
- Supply locations of services
- Weightings are optional; for example, they can reflect the capacity indicators of the supply (e.g., number of staff, sales area, turnover, etc.) or the amount of demand (e.g., population, purchasing power).
# Supply Analysis Methods
# Catchment Areas and Accessibility
# Introduction
# Is determining travel time or catchment areas sufficient for supply analyses?
Unfortunately, no.
We need more than just the simple travel times from a supply location to a demand location, as provided by determining travel times over catchment areas or distance matrices between all demand and supply locations.
While these types of analyses tell us whether a supply location is theoretically reachable, they do not tell us whether this location is practically accessible for all demanders. In English, this is referred to as accessibility, which we will discuss later.
# To understand the brief answer 'Unfortunately no', let's look at a concrete example in the next chapter Limits of Classic Catchment Area Analyses.
# Limits of Classic Catchment Area Analyses
Very generally stated: A catchment area is a geographical space surrounding a defined influence area of a specific object.
However, to give this a slightly sharper definition that is suitable for answering anthropogeographical questions, such as those in service research, we refine this definition:
A catchment area encompasses a geographical space around a service location that defines the service's influence area. The description of the enclosed space is made using distance or time units and can be formed by a straight-line distance (radial catchment area) or a construct of travel relations, e.g., road network.
The catchment area analysis allows for describing the characteristics of one or more catchment areas using geographical analysis methods. It is, for example, possible to identify the size (area, extension properties, topology) of the catchment area or determine the elements (potentials) within it.
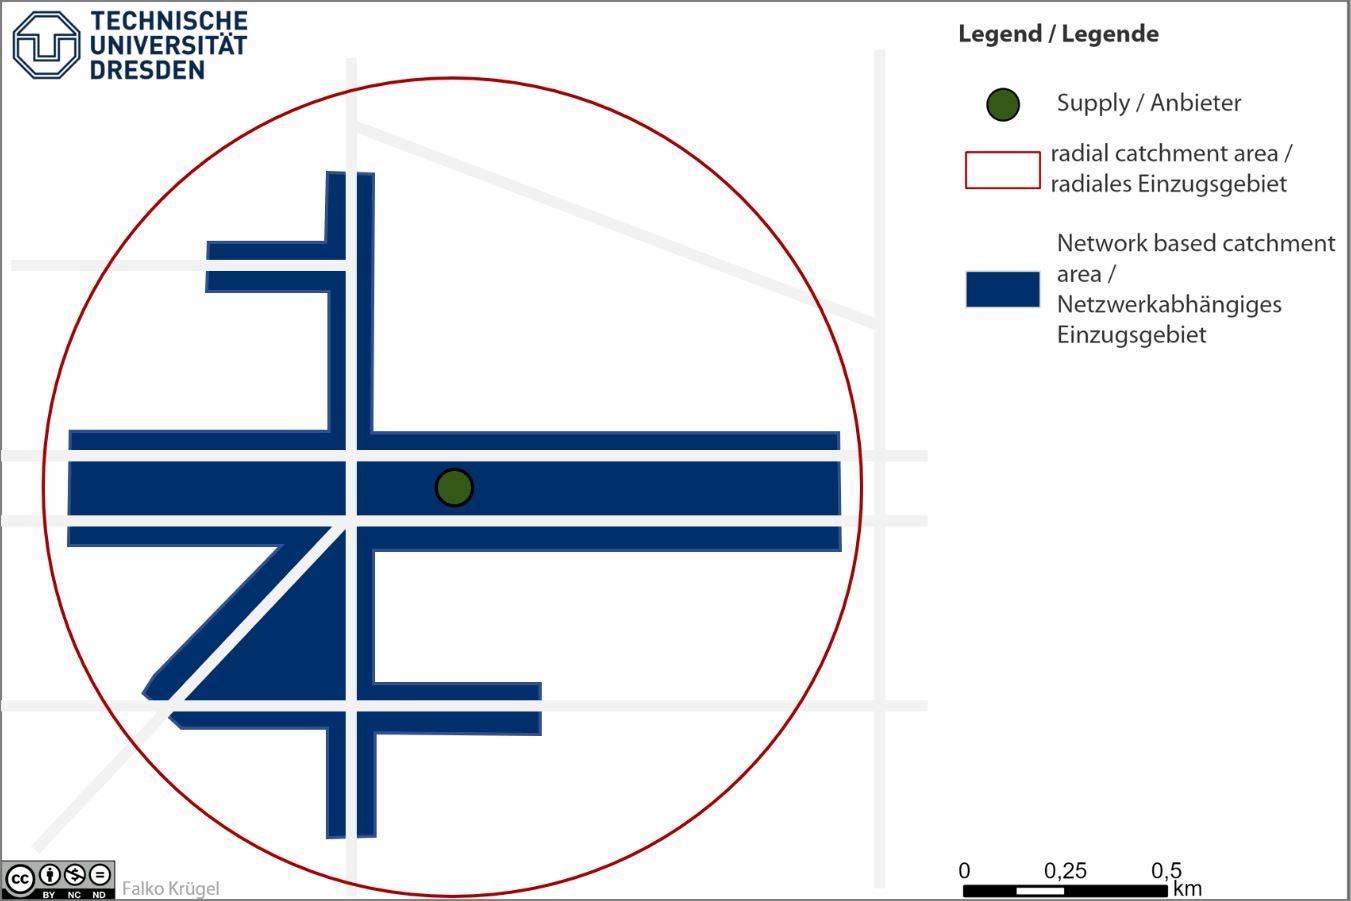 Fig.: Radial catchment area (red line) and network-dependent catchment area (blue area) around a service location.
Let's now build our example step by step.
We consider the demand for a service within a geographically distributed population in a randomly chosen area, which is to be supplied by the fictional provision of a service.
Assume the following:
Supply:
The supply of a service is represented by a general practitioner’s solo practice, whose professional staff can care for about 2,000 residents (and thus about 1,600 patients per quarter).
Demand:
A 100m x 100m grid represents the demand locations. The level of demand for a medical service is represented by the population at the residential location, indicated by the number within.
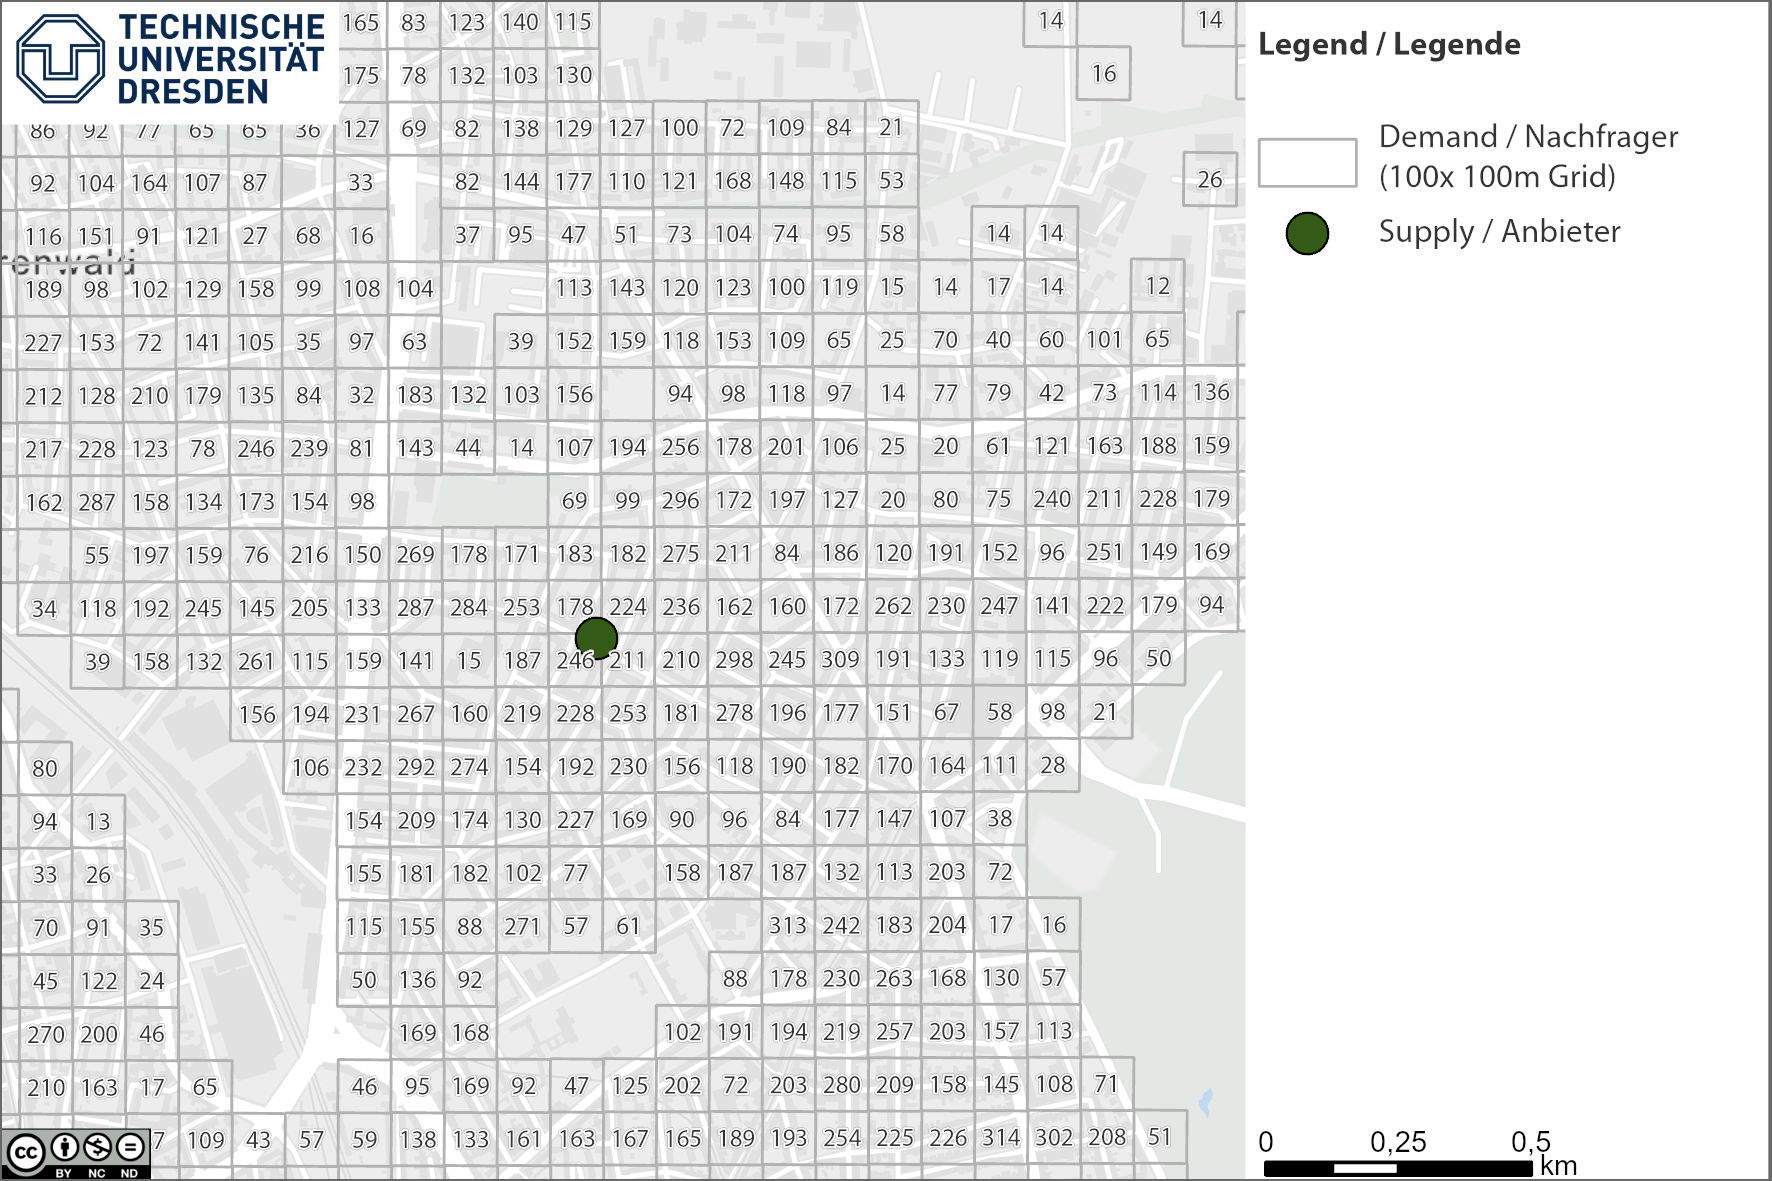 Fig.: Supply location (green dot) in a residential area in Hanover with residential population as demand locations (gray grid)
Let's now start with a simple catchment area analysis.
We want to find out how many people (demand potential) can reach the location within 2 minutes by car.
2-Min Catchment Area:
Which demand locations (population) for a service (general practitioner service) can reach the service location (general practitioner practice) within two minutes by car?
Demand Potential:
How large is the demand potential for this location?
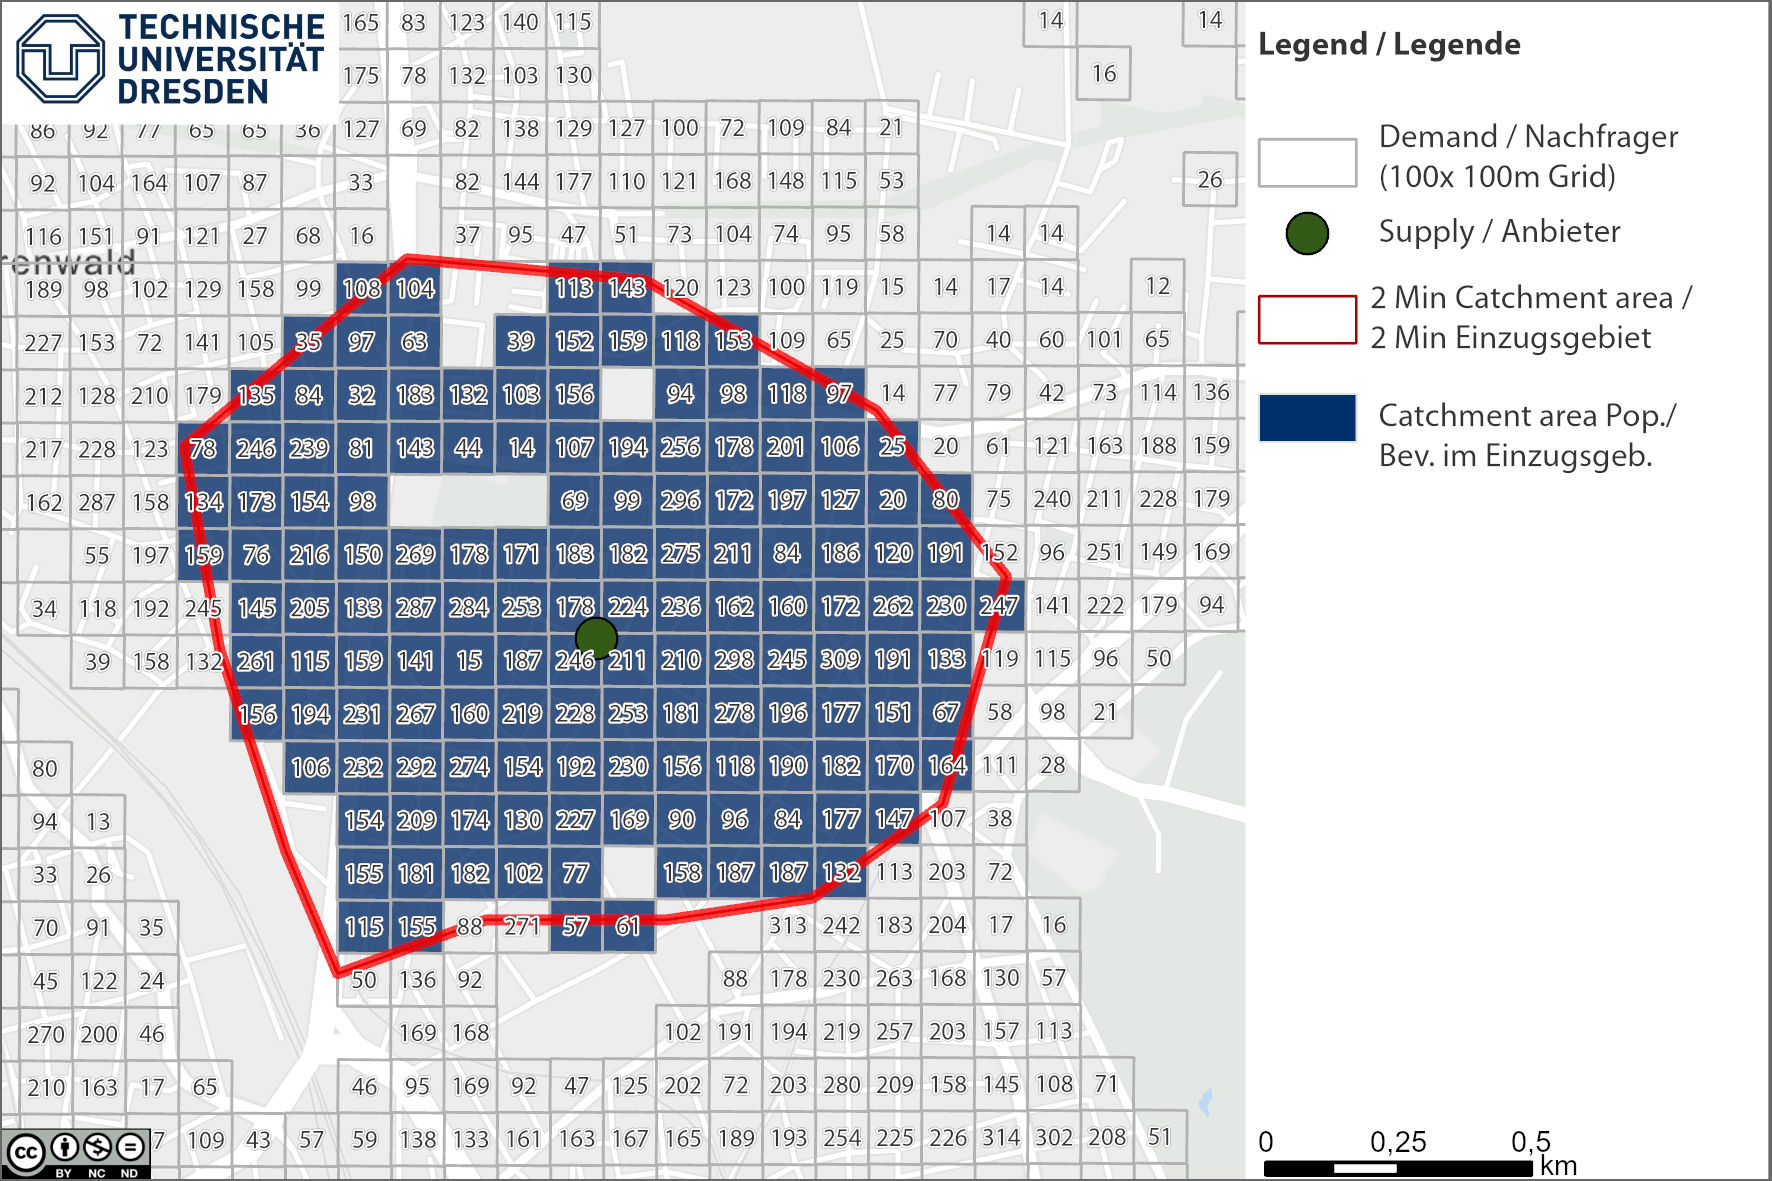 Fig.: 2 min car catchment area around the supply location (green dot)
# What answers does our geographical catchment area analysis give us?
- The spatial extent of the catchment area and the contained demand locations.
- The amount of population that can reach a medical service location within two minutes by car.
If we sum up the population in the catchment area, we get quite an impressive number of 23,211 people who could potentially be treated by the solo practice.
We can make the following statement:
More than 23,000 residents can reach a doctor's office within 2 minutes by car.
And thus, we arrive at the limits of classic catchment area analyses.
Just because we know the service area of an infrastructure and the contained demand potential does not mean that we understand the situation or quality of service for the people in the catchment area. In fact, not all individuals can be treated in this solo practice, so while the practice may be reachable, accessibility for a large portion of the population may not be available.
# Limits of Catchment Area Analyses:
These geographical analyses answer the question of whether a service is reachable. However, they do not provide an understanding of whether a service is available to the demanders (question about a dimension of accessibility in the context of capacity).
Therefore, let's turn our attention to gravity-based analysis methods in the next chapter:
# Theory of Gravity-Based Analysis Methods
So-called gravity models are used in spatial planning to predict and describe certain behaviors that resemble the gravitational interaction described in Isaac Newton's laws of gravity.
In general, social science models contain elements of mass and distance, which gives them the metaphor of physical gravity. A gravity model provides an estimate of the volume of flows of goods, services, or people between two or more locations.
Considering the spatial attraction is an important prerequisite for more realistic analysis of service situations. We will focus on the 2SFCA method group (English: Two-step floating catchment area method). To approach the method, we will proceed step by step with concrete examples.
In 2009, Luo and Qi developed the Enhanced Two-Step Floating Catchment Area (E2SFCA) method to enable a measurement that is intuitively meaningful for determining spatial access to (health) service providers. It is based on previous ideas by Luo and Wang (2003) (opens new window) and Radke and Mu (2000) (opens new window). Huff (1964) (opens new window) developed basic concepts for calculating catchment areas based on probability models, which also form an important foundation for the methods described here.
The derivation of the E2SFCA will proceed as follows:
- For each supply location (Suppyer) S1...
- ... locate the geographically distributed population locations (Population) of Pk...
- ... that fall within a catchment area with a distance (Distance) from d to _d0.
- Calculate the ratio (Ratio) Rj between the supply location and the respective population within the catchment area.
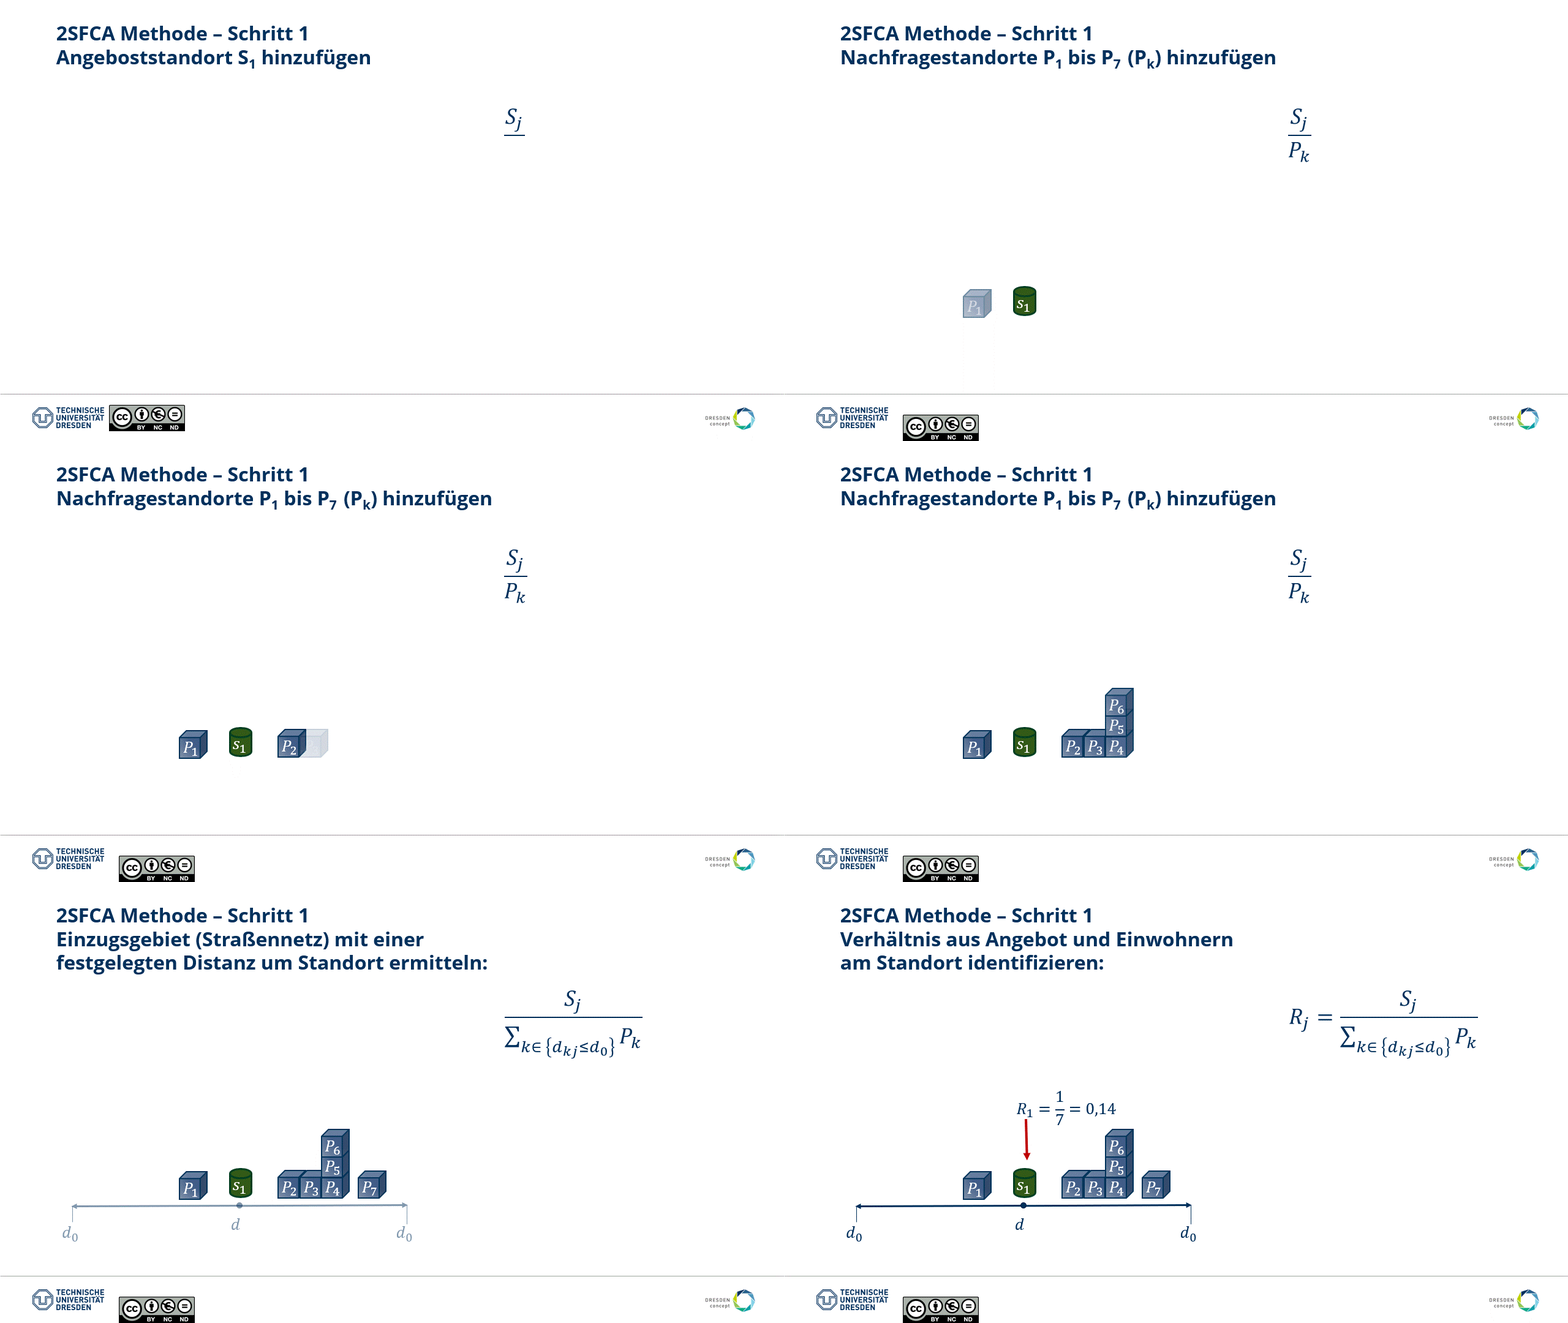 Fig.: Step 1 of the 2SFCA method - determining the ratio between supply (Pk) and population (Pk).
- The first step is repeatable for all locations. Note: This step allows for weighting capacity characteristics at a supply location, as visible at locations S2, S3, and S4.
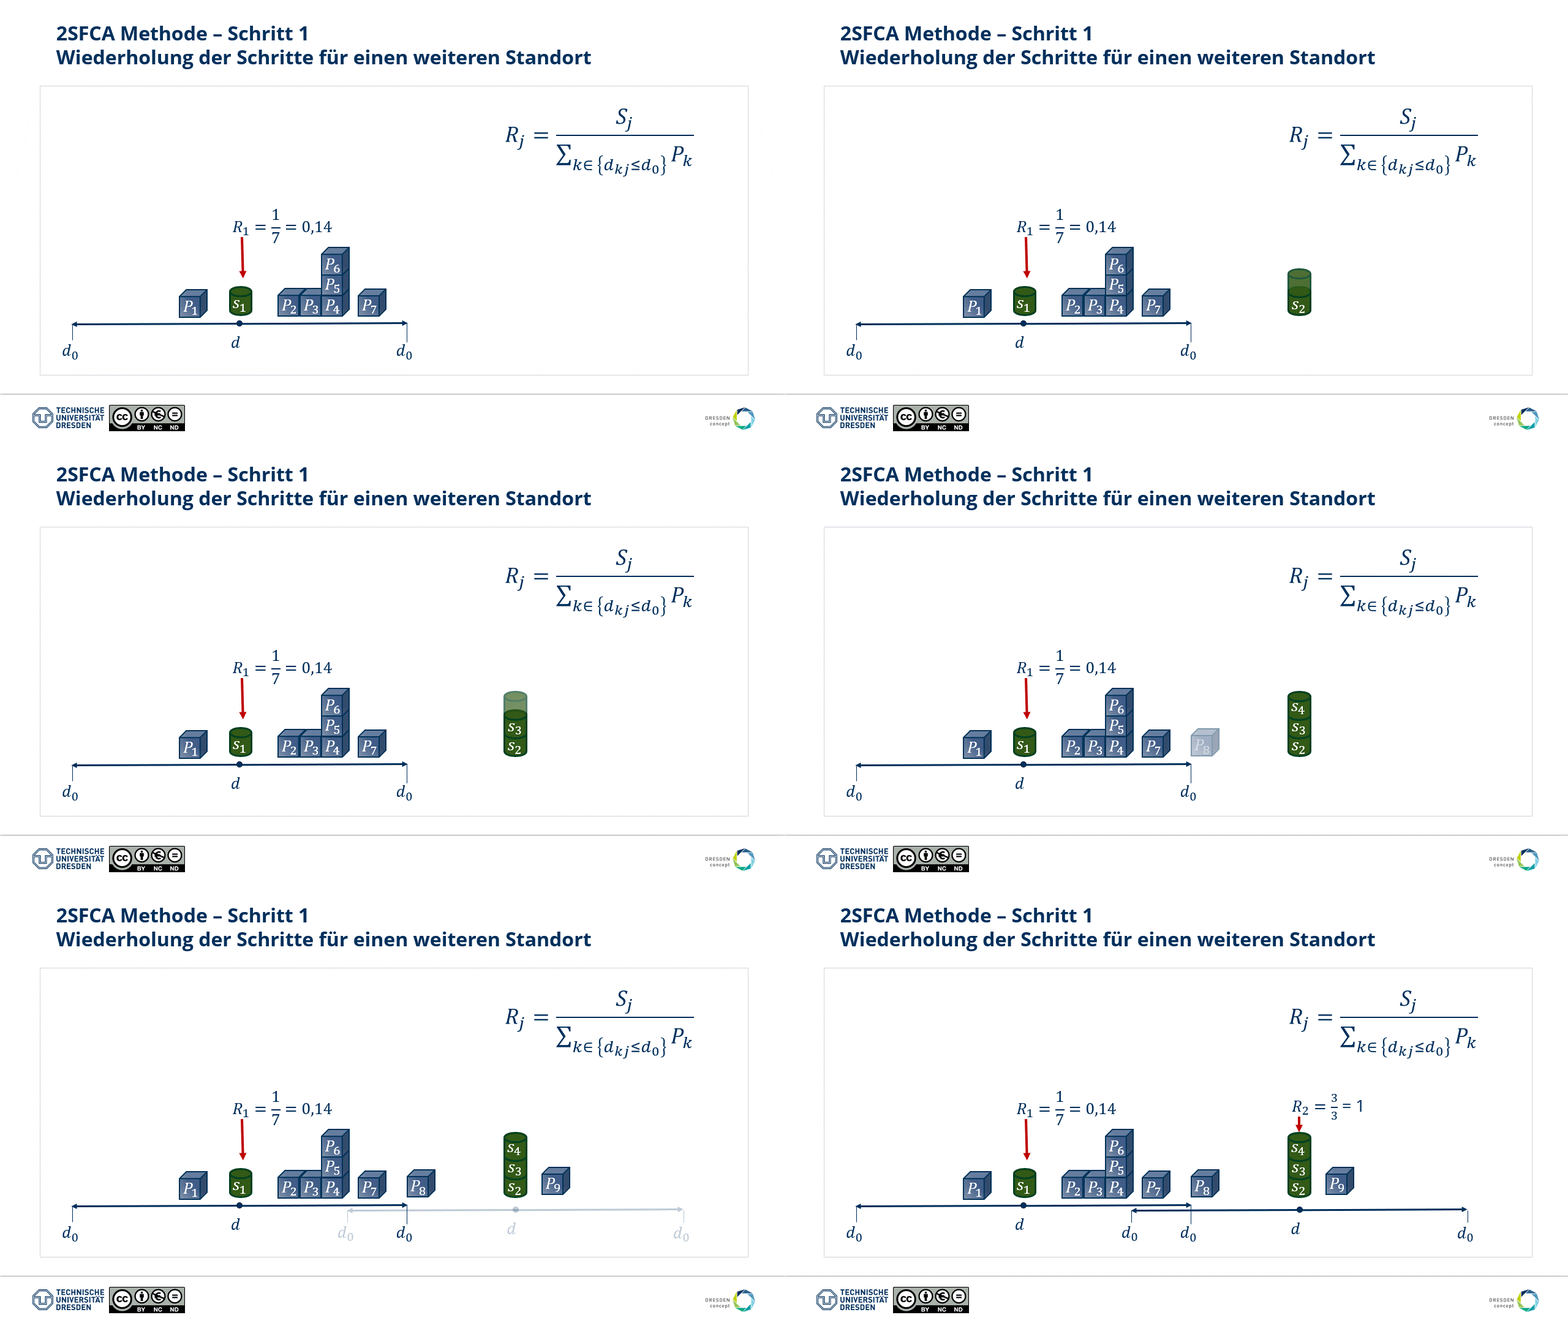 Fig.: Step 1 of the 2SFCA method - repeating for all further locations.
- For each population location within the catchment area threshold d0, find all reachable supply locations and sum their ratio Rj from step 4.
 Fig.: Step 2 of the 2SFCA method - repeating for all further locations.
According to Tobler's (1970) (opens new window) first law of geography, everything is related to everything else, but nearer things are more related than distant things. So far, the gravitational relationship is not considered through distance in our approach.
Therefore, we implement a distance-dependent weighting function to make the "Enhanced" in E2SFCA justified.
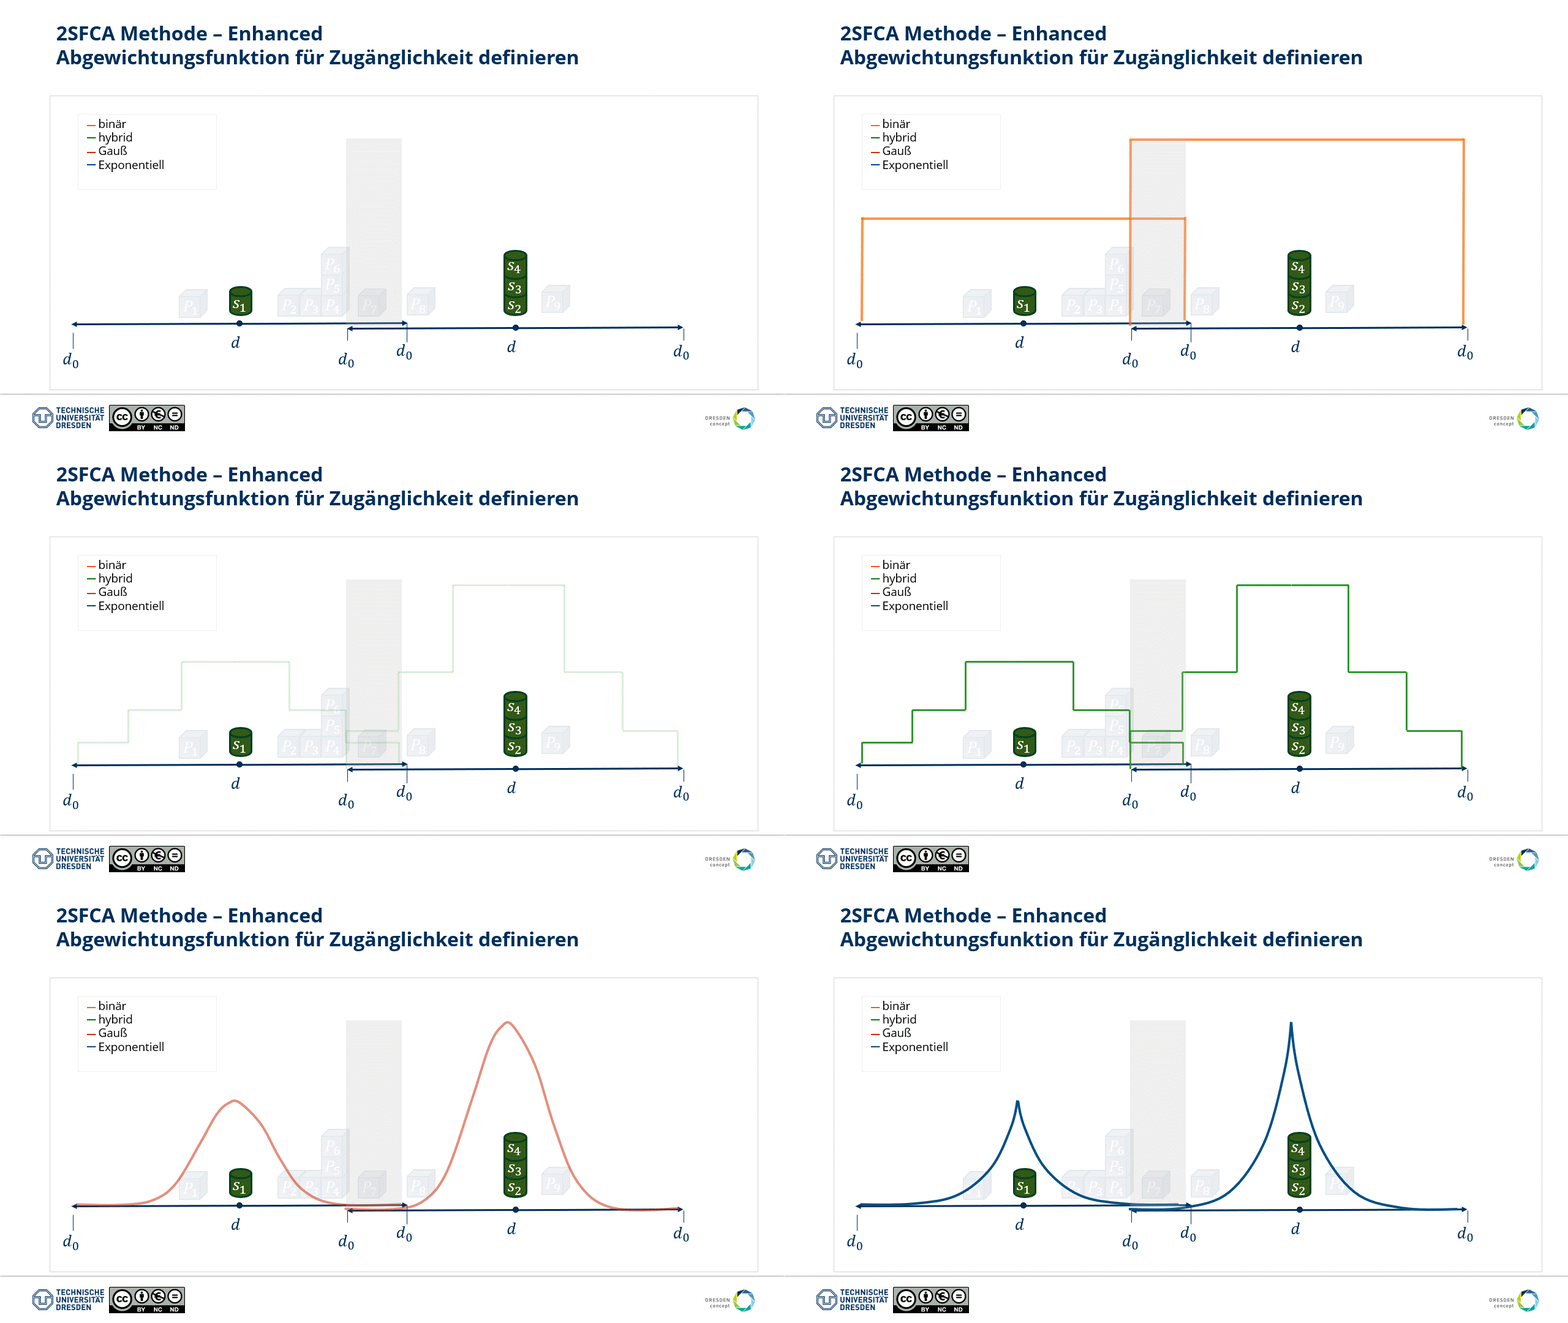 Fig.: Various weighting functions can be established over distance.
The type of weighting and the choice of catchment area size are crucial for the plausibility of the result. However, they strongly depend on the subject of the study and the corresponding "technical question."
In the next chapter, we will illustrate this sequence with a concrete practical example using maps:
# Practice with a Geographical Example
Here, it's still growing!

Great things also grow from cabbage and turnips! We are still working on the presentation of the methods section, are continuing to work on the design and are improving the structure and content.
Until then, this area is for internal use only. It is still a bit of work and we ask for your understanding.
ToDo:
Expand further